Recover fuel while assets stay online.
Prime, standby and peaking generators convert fuel into revenue only when combustion remains efficient under load.
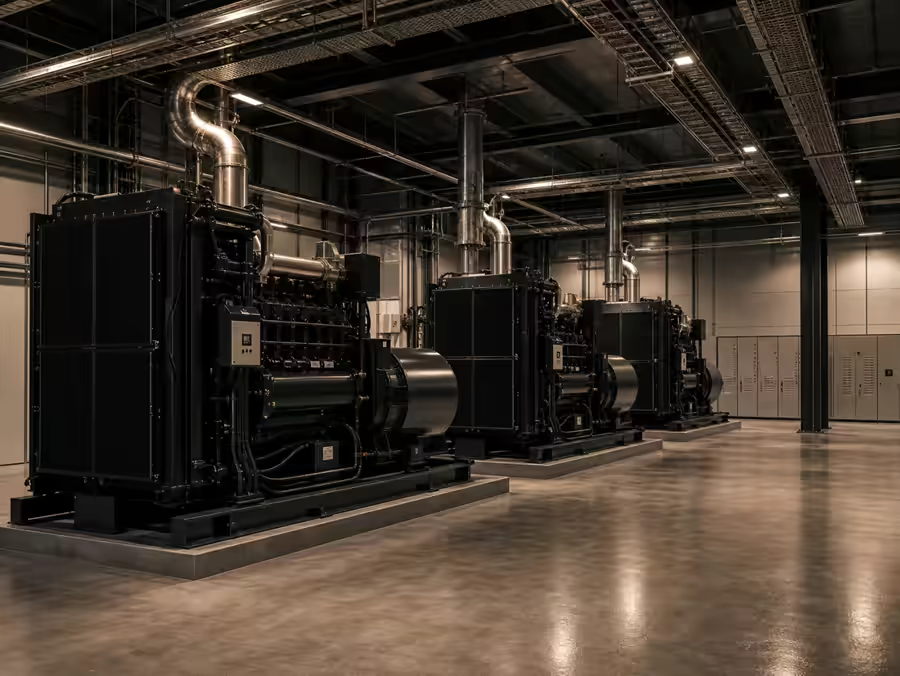
Gensets, peakers and island grids lose money when diesel burns rich. NTROPYX turns cleaner combustion into lower fuel waste and stronger maintenance economics.
Prime, standby and peaking generators convert fuel into revenue only when combustion remains efficient under load.
Cleaner burn behaviour supports a stronger maintenance conversation for sites where availability matters.
The buyer can connect litres, duty cycle, dosage and annual operating gain without changing the generation asset.
Immediate message: fuel efficiency, cleaner combustion, lower waste and a commercial path sized to the sector.
European public electricity & heat plants burned 97 752 TJ of gas oil & diesel in 2023 (Eurostat) — ~2.72 Bn L diesel-equivalent — in oil-fired turbines, peakers, island grids and standby gensets. Cleaner combustion stretches oil-change intervals where every running hour is billable.
Derivation: Eurostat [nrg_bal_c] series TI_EHG_MAPE_E / siec O4671XR5220B = 97 752 TJ EU27. Converted at diesel LHV 36 MJ/L → 2.72 Bn L.
TI_EHG_MAPE_E × O4671XR5220B (Transformation input, main activity electricity & heat producer / gas oil & diesel) × TJ × 2023. Diesel-equivalent conversion: LHV 36 MJ/L. Power-mix shares from same dataset, full siec breakdown. Switzerland not included: Swiss public electricity is hydro/nuclear/solar dominated, oil-fired generation negligible (BFE 2023). — 2024 & 2025 not yet published in harmonised form by Eurostat; latest complete sectoral breakdown is 2023.