Make marine fuel work harder.
Daily vessel burn makes every percentage point material. NTROPYX turns fuel loss into a board-level operating figure.
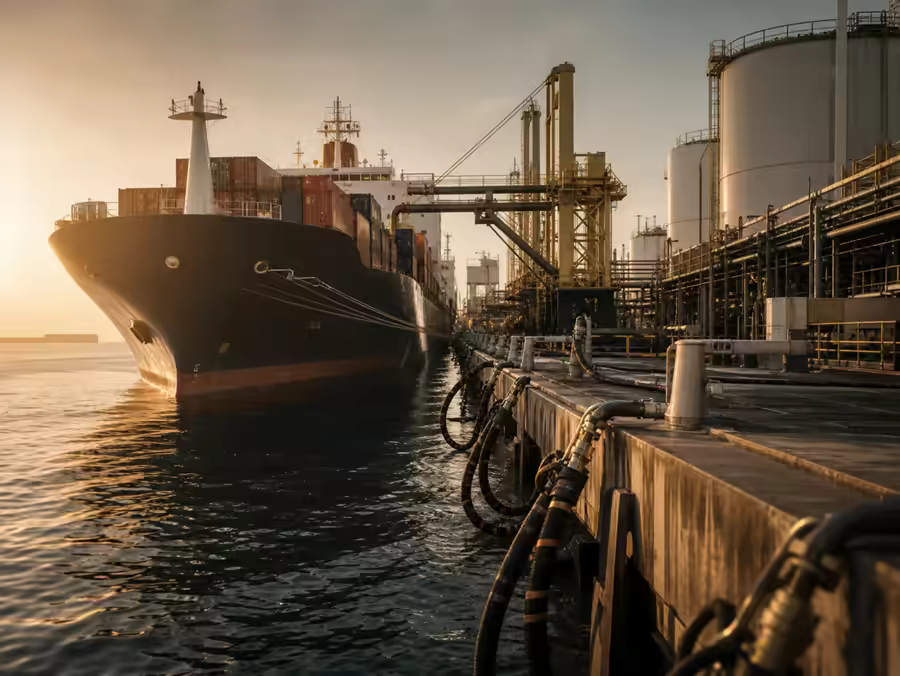
Marine fuel is bought by the tonne and lost by the hour. NTROPYX positions bunker consumption as a recoverable operating cost, not a fixed penalty.
Daily vessel burn makes every percentage point material. NTROPYX turns fuel loss into a board-level operating figure.
Brown and black marine NTROPYX address HSFO, VLSFO, MGO, MDO and IFO380 without hiding the engine context.
Caterpillar and Wärtsilä contexts give technical buyers the right starting point before volume, route and supply discussion.
Immediate message: fuel efficiency, cleaner combustion, lower waste and a commercial path sized to the sector.
European international maritime bunkers consumed 1 597 296 TJ of liquid fossil fuel in 2023 (Eurostat) — ~44.4 Bn L diesel-equivalent. Heavy fuel oil dominates ocean-going engines (74%), gas oil powers cleaner SECA-zone operations (23%). At the catalyst dose used in the Caterpillar & Wärtsilä bench evidence, the recovery scope is unmatched per litre.
Derivation: Eurostat [nrg_bal_c] series INTMARB / siec O4680 (fuel oil 1 221 699 TJ) + O4671XR5220B (gas oil 375 597 TJ) = 1 597 296 TJ. Converted at diesel LHV 36 MJ/L → 44.37 Bn L diesel-equivalent.
INTMARB × O4680 + O4671XR5220B (international maritime bunkers, fuel oil + gas oil) × TJ × 2023. Diesel-equivalent conversion: LHV 36 MJ/L. Switzerland excluded (landlocked). — 2024 & 2025 not yet published in harmonised form by Eurostat; latest complete sectoral breakdown is 2023.